Demo
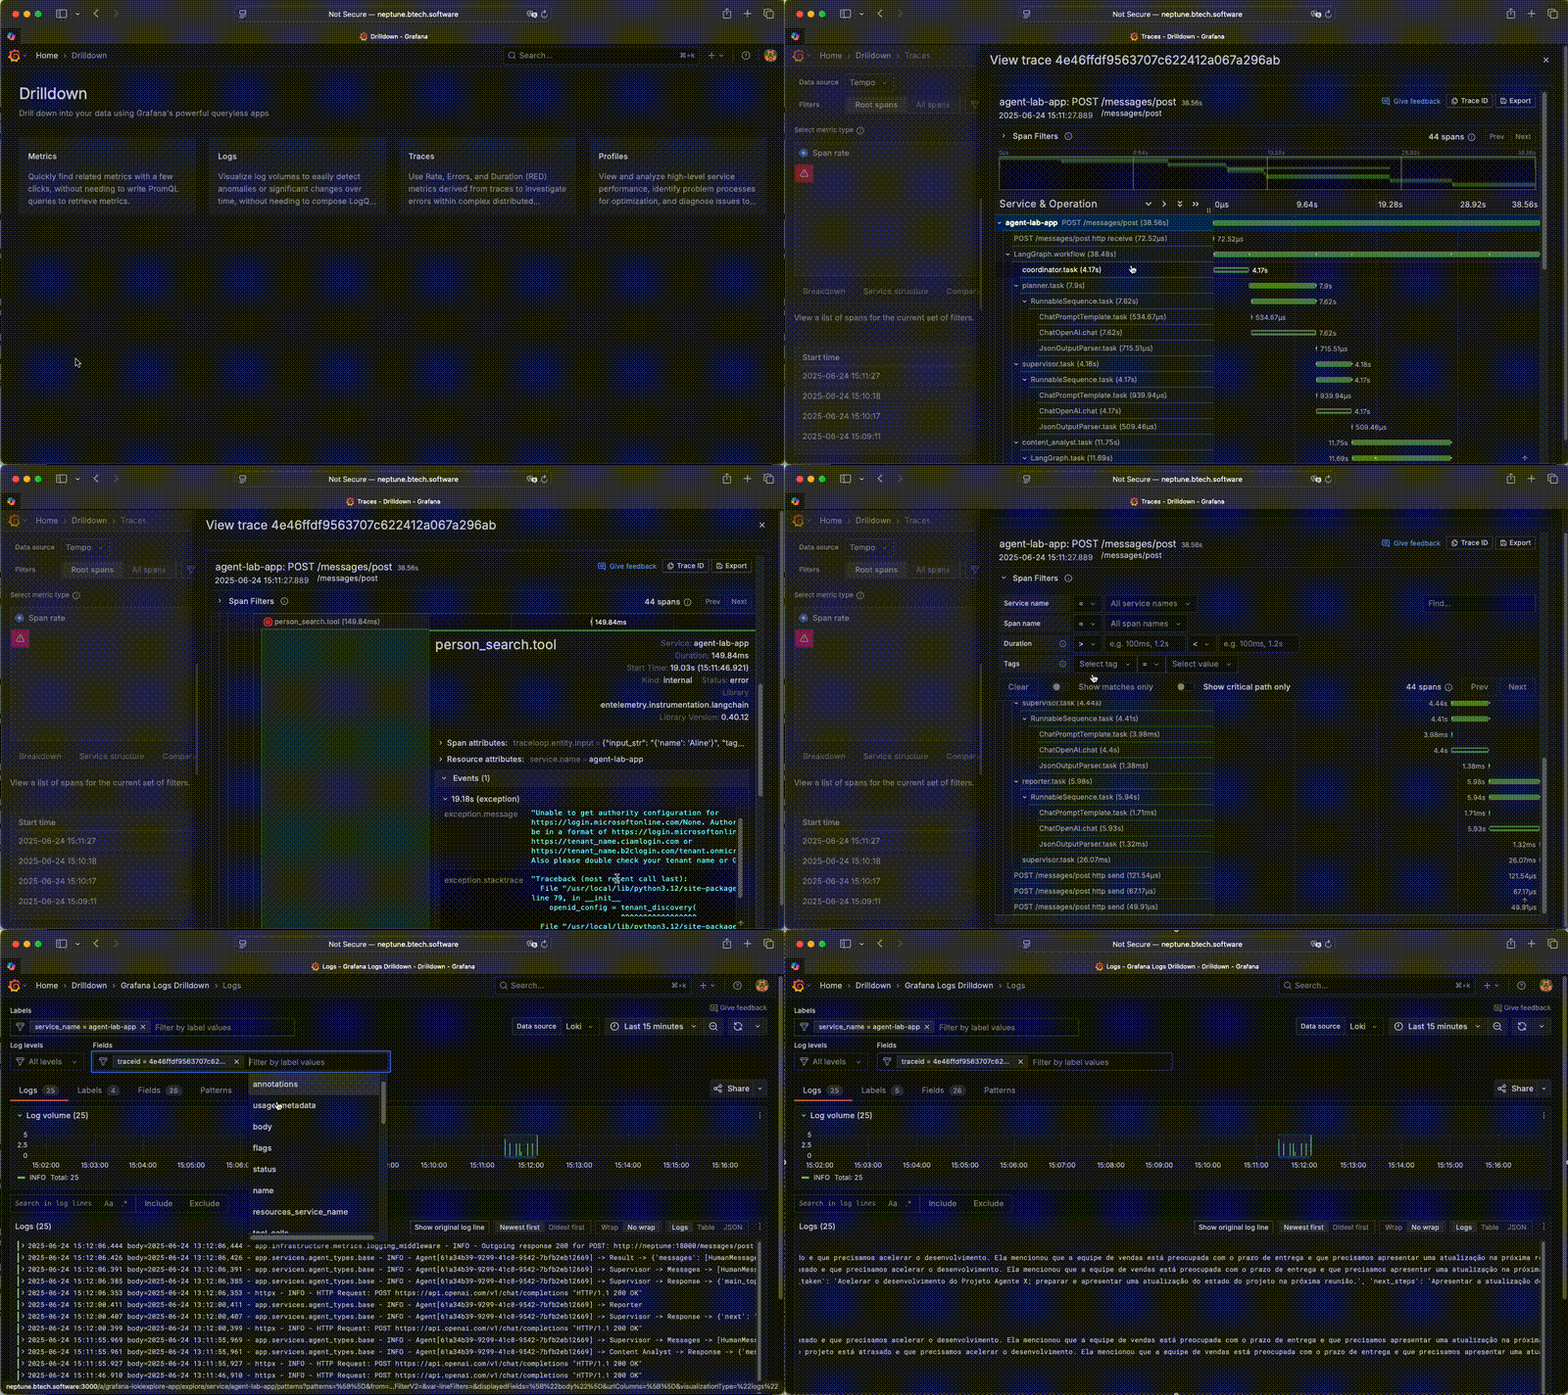
Reference implementation
The reference implementation of Grafana observability lives in the
otel/grafana/ directory: the OpenTelemetry Collector configuration
(otel-config.yml), Prometheus scrape config (prometheus.yml), Tempo trace
storage (tempo.yml) and Grafana datasources (datasources.yml).
These settings are consumed by the compose-grafana.yml file, which starts the
application with the full stack — OpenTelemetry Collector (OTLP on :4317/:4318),
Prometheus, Tempo, Loki and Grafana.
Run it and open the dashboards (see Running the Application):
docker compose -f compose-grafana.yml up --build- Grafana UI: http://localhost:3000 — default credentials
admin/admin - The app's API: http://localhost:18000/docs
What to look at: per-request HTTP spans, nested LangChain LLM calls with token usage, SQLAlchemy statements, and application logs in Loki. What gets instrumented and why: the Observability guide.
Note: this implementation is just a reference. For a real production scenario, take privacy and security settings into account — authentication, authorization and encryption.